

| Index |
| PicAXE Data Logger |
| A Better PicAXE Data Logger |
| Keyboard Wedgie Deux |
| Amplifier for Commercial A/Ds |
| Peculiar Data Logger Deux |
| PicAXE Frequency Counter |
| Improved V/F |

(or other programs)
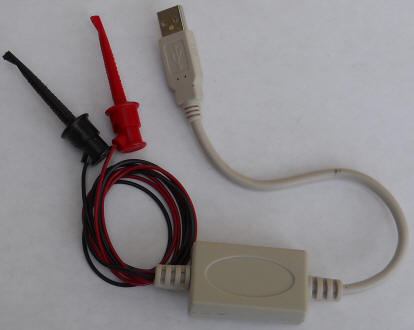
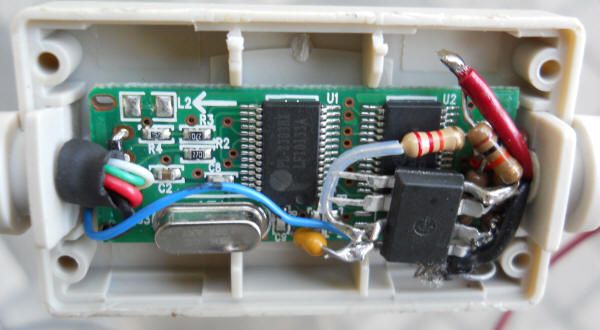
A PicAXE measures the voltage on an analog input pin and sends 10 bit data to Amaseis for plotting. I decided to dedicate a $6 USB to serial adapter to the job and when I opened the case I discovered enough room for the PicAXE and the few needed resistors. There's 5 volts in there, too. Originally I planned to take out the board and move it to my own larger case. The red and black test leads come out the hole previously used by the DB-9 serial connector.
I used "dead bug" construction making sure to keep everything low so the case would snap back together. Before removing the 9-pin serial connector from the adapter I plugged in a PicAXE programming cable with the stereo phono plug on the end and used an ohmmeter to discover which two serial wires inside the adapter I needed, making a note of which color did what (serial in and out). I also found a place to connect a wire to the +5 VDC from the USB cable at the other end. There was a handy via in the board for that yellow 0.1 uF capacitor. The schematic is quite simple:
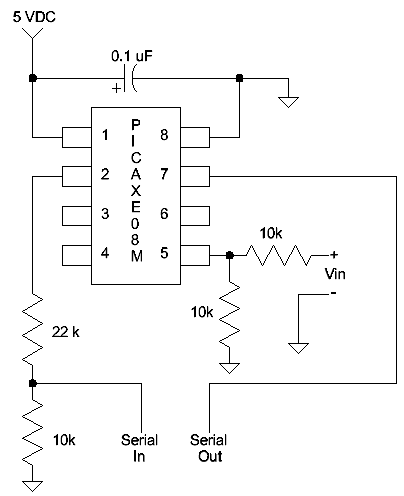
I used a voltage divider on the input giving the device about 10 volts full-scale range (mine tops out at about 9.5 volts). These resistors also protect the PicAXE from damage to some degree. Feel free to add an op-amp buffer here; I'm shooting for simplicity. Here's the simple program for the PicAXE:
main:
setfreq m8
senddata:
for b0 = 1 to 64 ; the sum of 64 10-bit readings fits into a 16 bit word
variable
readadc10 2,w1
w2=w2+w1
next b0
w2 = w2/64
sertxd(#w2,13,10)
w2 = 0
pause 200 ; this is actually a 100 mS pause due to the higher 8 MHz clock
setting
goto senddata
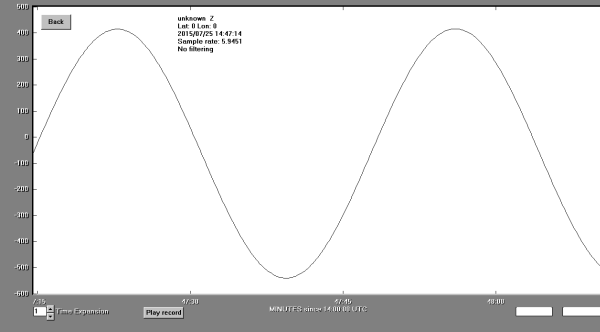
The "pause 200" could be increased greatly or even replaced with a little loop to slow down data taking for other applications. The 100 mS pause combined with the for loop gives about 6 readings per second, a fairly common rate for seismometers apparently. You may need to play with that pause value to get your desired rate especially if you switch PicAXE types. I'm using the older PicAXE08M. It works well; here's a plot of a 30 millihertz sinewave biased up to 5 VDC and swinging about 9 volts p-p:
Once the device is built, simply plug it in and start the PicAXE editor program. Find the right com port and select the right PicAXE and paste the program above into the editing space. Then simply click the program button. When it's done close the editor and wait a few seconds for the port to be released. Now start Amaseis and select the right com port. Also set the "device" to "SEPUK1." Set the offset to zero and the gain to 20. You should be able to apply a DC voltage to the input and see the result on the plot with a sensitivity of about 1 volt per "division" where a division is one of the hour lines. Adjust the gain and offset to suit your purpose. Amaseis plots will overlap if the data moves around a lot but simply drag the cursor across the time of interest and click on "extract earthquake." Remember to highlight the desired time on the appropriate line and not the data itself which might be moving all over the screen. Once you play with Amaseis a bit you will discover it's a quite versatile data logger.
This little thing could be used for other programs that accept serial data. The program is easily changed since it has a built-in USB interface - just remember to close any other program using the serial port so that the editor can take over. You can also change the program to send data to a spreadsheet using the Autohotkey script described below. That script lets you send "navigation" commands to a spreadsheet.
Remember, you can stop Amaseis (or other application), start the PicAXE editor, make changes to the PicAXE program, close the editor and restart Amaseis - all without touching the hardware.
Note: Amaseis is great for AC-coupled data but not perfect for DC-coupled measurements. When you select a section of time to "extract" the zero point is the average of all the selected data. That's great for centering the waveform but it looses the DC information. I'm still looking for a free DC-coupled strip chart recorder. But this program is perfect for lots of data over long periods of time from seismometers, infrasound microphones, SID monitors or any quantity that deviates from a "normal" level. I haven't used JAmaseis yet but it seems to have an "offset" value so perhaps it preserves the DC value.

This enhanced data logger dithers the input signal for more resolution than the PicAXE A/D offers (see an explanation). It is well-suited to ratiometric sensors like bridges and potentiometers since the PicAXE measures the input voltage as a fraction of the power supply voltage; simply run the sensor on the same power supply as the PicAXE. Use an accurate and stable voltage regulator when absolute accuracy is required. One "trick" is to run the PicAXE on 4.095 volts so that each step represents 4 mV "exactly" (well, quite closely). The 8-pin 08M2 has just enough pins for the resolution enhancement technique described below without using the serial I/O pins that will usually be quite busy sending data to a computer. The design is simple; a 3.3k resistor is inserted in series with the 08M2 PicAXE's voltage input (pin 3 or C.4) and 10 megohm resistors are connected from pins 5 and 6 (C.1 and C.2) to pin 3. Making pins 5 and 6 cycle through high, low, and floating causes the input voltage at the PicAXE to vary up and down by about 1 bit's worth. There are five states with both pins pulling up, only one pin pulling up, both pins floating and one then two pulling down. (I make the pins float by making them inputs.) Five loops sum the voltage 10 times each then add the results for a total of 50 measurements. This dithering technique requires the 3.3k input resistor be driven by a low resistance source like the output of an amplifier. A typical circuit is shown in blue below. A rail-to-rail operational amplifier is an excellent choice, even if it is only used as a voltage-follower.

The dithering and averaging makes the resolution excellent for signals near V/2 and is still quite improved over the full range. Below is the plot of a very slow and very small sine wave, so small that the individual A/D steps are easily seen. The second plot is the improved waveform at the same magnification using the circuit above. I used JAmaseis and a very slow sine generator to make the plots. There's a selected delay ("pause 137") that I adjusted to get JAmaseis to report the data rate is 6 Hz (see the program below). That's a common speed for seismometers, or so I've read. Increase that delay for slower samples; I plot my solar flare detector's output using 10 second delay, plenty fast for solar flares.
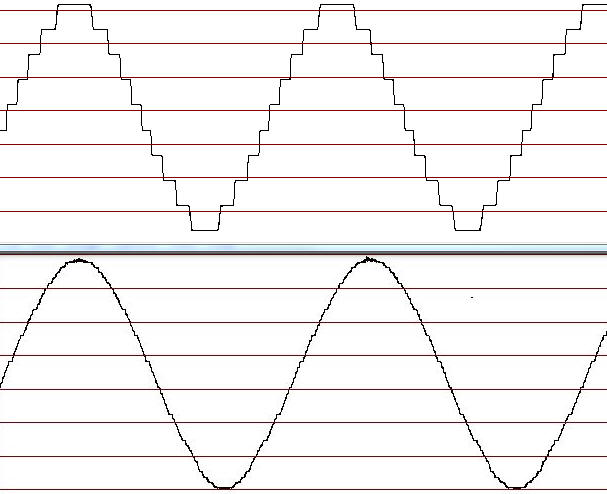
Usually, the 1024 vertical values (10 bits) that a PicAXE can provide is enough for a great-look plot, but this better resolution ("nearly" 12 bits) allows the user to zoom in for more detail when using programs like JAmaseis (seismograph program) or even a spreadsheet. The plot below shows how well it works when the signal is only 5% away from the limits and the improvement is still worth the three resistors needed!

The program is straightforward and looks a little busy due to all the comments (in green). Just copy all of it and paste it into the PicAXE editor then click on "program." There's no programming expertise required.
'Program uses analog dithering for better resolution. 10 values are summed in
each of 5 dither states.
'For a total of 50 values. The sum of the 5 sums is the output.
'10 megohm resistors connect from C.1 and C.2 to C.4 and the analog signal
connects through a 3.3k
'resistor to C.4. Changing the outputs of C.1 and C.2 can thus move the input
voltage up or down
'a slight amount, about one bit's worth.

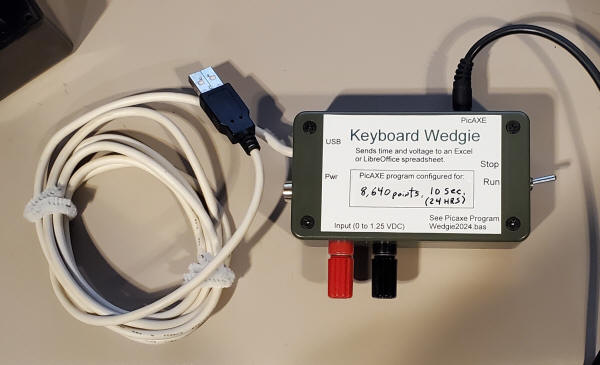
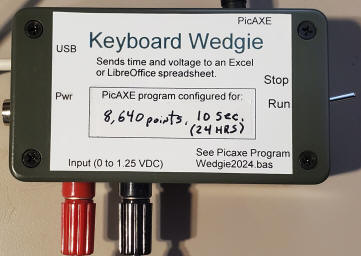
Plug this in and wait for the driver to be installed, start a LibreOffice or Excel spreadsheet (give it "focus" by clicking on any cell), then flick the switch to "run" and data will be typed into the spreadsheet. The program is set up for 24 hours of 10 second readings but that's easily changed in the PicAXE program.
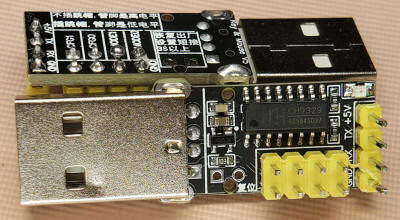
The original Keyboard Wedgie used a PicAXE to "press buttons" on an old keyboard by shorting the correct wires on the keyboard's internal circuit board. One big advantage to this technique is that no special (i.e., suspicious) software need be installed. There's a better way than hacking a keyboard that uses the CH9329 Serial Port to HID Keyboard and Mouse Chip. The little boards with the yellow connectors shown below feature this IC and they can be purchased for under $2 if you shop around. In "Mode 1" these boards will receive ordinary ASCII from a PicAXE and send it to a computer as keystrokes from a USB keyboard. But there are a couple of catches. First, the serial I/O is "TTL" as opposed to "RS232" which means the logic polarity is reversed from the PicAXE serial programming pins. Simple solution: use a different pin to send data to the CH9329 using positive polarity. Or just add an inverter IC to invert the signal from the programming pin. Either way, the serial needs to be 9600 baud. Another complication is that ASCII doesn't have any characters to move up the page; I suppose that was hard to do with old teletype machines! But this IC also has a "Mode 0" that can do just about anything a keyboard and mouse can but it's rather difficult to use. This project uses the difficult Mode 0 but I've made subroutines that handle the complexity; just call a subroutine to navigate around a spreadsheet and to enter numbers into a cell. I didn't include letters because that would take a rather large look-up table since the characters are in the order that they are on a keyboard (like QWERTY). So no simple math will yield the code. On the other hand, these boards are cheap. If you need letters and other ASCII characters, consider using two boards plugged into one of those old, slow USB hubs in your junk box. : ) One board would be used for non-ascii (like Ctrl-Home) and the other for ordinary letters and other ascii characters. Frankly, for logging data, letters aren't usually needed and the supplied subroutines handle numbers and navigation around a spreadsheet.
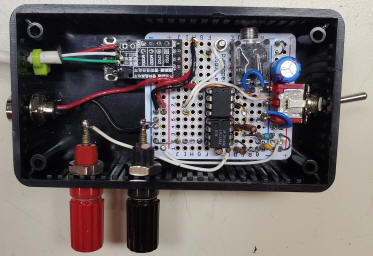
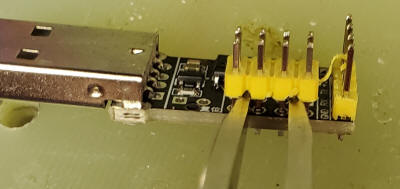
The circuit is pretty simple and includes an operational amplifier for gain and very high input impedance and also to protect the PicAXE. In many applications the op-amp could be left out. Not shown in the schematic is a panel-mount LED and 470 ohm resistor connected across 5VDC. (Power comes in the USB connection from the computer.) My version is built on a protoboard with the layout of a breadboard. I pried off the double-row yellow plastic connector body with tweezers to make the removal of the pins easier then jumpered the Mode0 holes. This allowed me to flip the board over and solder the single-row pins to the protoboard. I also removed the USB connector and soldered a USB cable directly to the board. If you also remove the USB connector, use an ohmmeter to make sure you are connecting the pins of the new USB connector to the same pins as the one you removed. Mine were color-coded ensuring that, at least, I got the outer power supply connections correct. Getting that wrong would be an "unfortunate" mistake involving smoke and angst. So it wouldn't hurt to plug the cable into a computer and checking the polarity before connecting it! The PicAXE USB cable is only needed for programming. Both connections may be connected simultaneously making experimenting with the program quite easy. The program in the pictured version takes 24 hours of data every 10 seconds but those values are easily spotted in the program and may be easily changed. Pin 5 is available for another input (perhaps using a dual op-amp) and the spreadsheet navigation subroutines could be used to make a three column spreadsheet with time and two variables.
The PicAXE program can look intimidating but one can simply copy all the code and paste it into the PicAXE Editor then click on "program." There's no need for an understanding of the programming language at all! That makes it a pretty simple project. My spreadsheet splits the screen so the graph stays put (click on a cell in the lower-left section so that data is entered down there and that lower section rolls up instead of the top section with the graph).
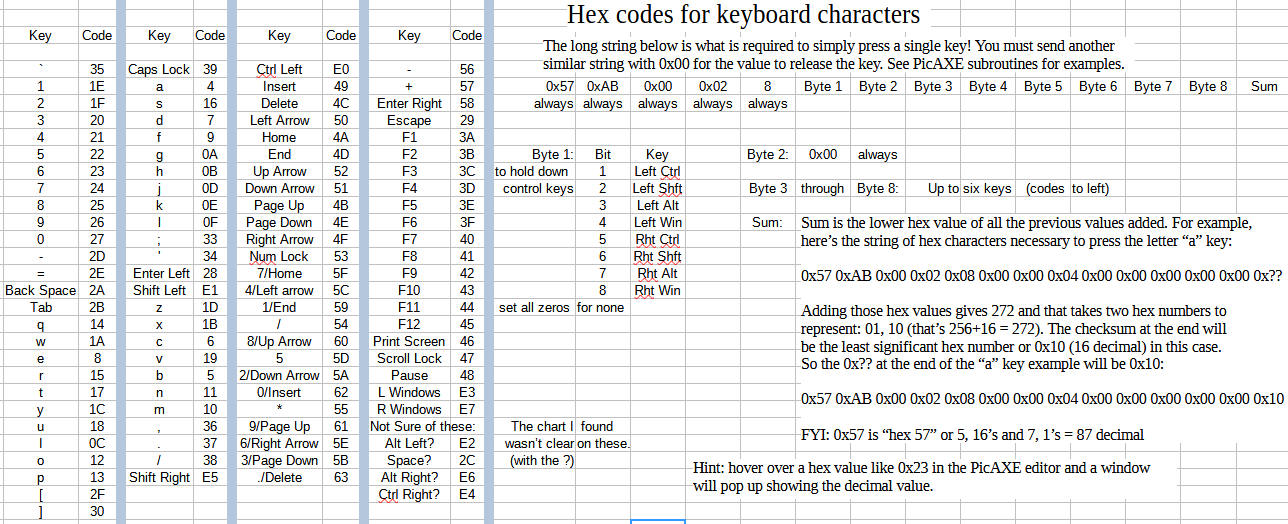
If you like programming the PicAXE or other processors there is an English translation of the CH9329 manual that I found once but now can't! I have it but I don't know if it's copyrighted so I won't post it here but I made a chart for my own use (see image below). I haven't figured out a few of the codes (with question marks) and that includes the space bar. Also, the PicAXE program subroutines are explained in the listing so the program could be modified to behave differently without much effort.
Windows will install a driver for the CH9329 and LibreOffice or Excel is needed but no other programs are necessary. You could comment out the time (ctrl,shift,;) and use notepad or any other program that accepts numbers.

Refer to the subroutines in the PicAXE program listing to see how the chart below would be used. It takes a lot just to press a key and just as much to stop pressing the key!

The photo shows a CD40106 but use a 74HC14 to get sufficient current to run any op-amp.
This simple amplifier is useful for boosting small signals up to about +-12 volts. Many low-cost commercial data acquisition devices have full-scale inputs of +- 10 volts which limits their sensitivity, and the negative part of the input range is usually wasted, cutting the available resolution in half. This amplifier runs on 5 to 6 VDC and generates about +-15 VDC to power a single op-amp. (Use an op-amp that is designed for +- 15 VDC operation.) The op-amp circuit includes an offset voltage capable of converting a single-ended positive input into a symmetrical bipolar output; adjust the zero potentiometer to get -10 volts out with zero volts in. The circuit is efficient so running the device on a lantern battery for ground isolation is practical. The circuit can draw as little as 1mA when using a micro-power op-amp. Or run the circuit on the 5 volts available on the USB port.
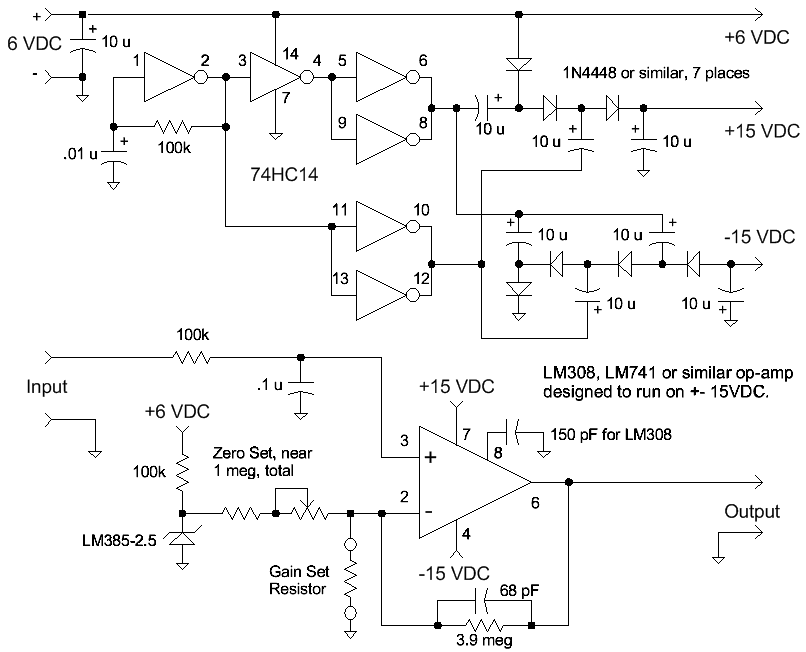
The LM385-2.5 injects current into the summing node through an adjustable resistor with a value near 1 megohm. A good-quality fixed resistor near 900k and a 200k potentiometer would be a good combination. The zero pot is adjusted to get an output near -10 volts with the input grounded (assuming -10 volts is the negative limit of the data acquisition device - other offsets are possible). The gain will be near 5 with no gain set resistor, and will reach about 100 with a 41k resistor. The zero might vary slightly when the gain is changed. Use a good-quality 3.9 megohm resistor.
Changes:
If you choose a different op-amp than the LM308, you will probably eliminate the
150 pF compensation capacitor and add whatever the new op-amp requires, per the
data sheet.
The zero offset components, including the LM385 and resistors,
may be left out if a bipolar input voltage is simply to be amplified. You might
also decide to offset the output to -9 volts, instead of -10 to give the
amplifier a little response below zero volts. That modification only slightly
reduces the resolution for a given input voltage span but also gives a little
visibility below ground.
To reduce the ripple from the voltage converter, add an electrolytic directly
from pin 7 to pin 4 of the op-amp. Bigger is better, but 47 uF at 50 volts
should be enough to drop the ripple below the resolution of the typical
inexpensive data acquisition device. To further fight ripple, connect the input
ground to the gain set resistor ground as directly as possible, then run a wire
from that connection over to the power input ground. Op-amps reject supply
ripple quite well so such measures may be unnecessary.
The 100k and 0.1 uF on the input rolls the frequency response off to about 15 Hz
and the 68 pF rolls the amplifier gain off at about 200 Hz. Both can be modified
to tailor the response.
Micropower Version for the experimenter: My original version used a couple of
NPN transistors to generate the two out of phase signals to drive the gates in a
CD4069. The unloaded power consumption was about 20 uA! (A two-transistor
astable oscillator can be made to draw less power than a linearized gate
oscillator.) I hooked that to a micropower op-amp to make a unit that draws only
40 uA when driving a DMM.

Here's another way to send data to a computer that doesn't involve a microprocessor, computer script or spreadsheet macro. It's the "Peculiar Data Logger" with slight modifications from my earlier version that uses my ratiometric voltage-to-frequency circuit, IR led and phototransistor to make a wireless data logger. The output of this version drives an optoisolater (same thing, really) to avoid connecting a noisy computer's ground to a sensitive circuit. The computer creates the plot using an FFT spectrum analysis program like Spectrum Lab. Spectrum Lab has features for automatically saving plots and a treasure-trove of other features making this data-taking scheme quite versatile. The circuit is quite inexpensive, employing one cheap quad comparator and a couple transistors:

(Don't choose subs for the MPSA18 and 2N4403, if possible. The 'A18 has very high gain, even at very low current and the '4403 has a zero temp-co saturation voltage when biased as shown.)
The front-end of the V/F accepts 0 to1 VDC and convert it to 1 to 2 kHz. I chose that frequency range to avoid harmonics appearing above the desired curve and for other programs that can't handle higher frequency (Argo, for example). With the 560k linearity resistor the overall accuracy is probably about 0.2% of full scale (assuming it's calibrated well). Selecting the linearity resistor for best performance can yield 0.05% linearity or better depending on one's patience and equipment. (Don't bother for SIDs.) The resistors are 5% types in the prototype and better accuracy is achieved by tweaking the emitter resistor for the proper gain and adjusting the "position" control to place the trace at the desired spot on the display.

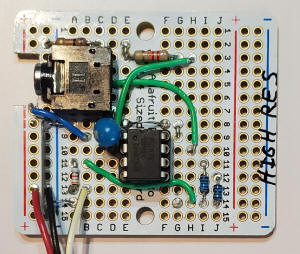
In the photo above the input comes in from the left and the first 5k pot is in series with a 121k resistor for fine-tuning the sensitivity. For variables like the SIDs detector output precision simply isn't needed; I just wanted to make it "perfect" so just replace the pot with a jumper for most applications. The pot on the right moves the zero much like the vertical position control on an oscilloscope. The metal can part to the right of the IC is an old optoisolator (3N244) but any LED/NPN type should work. The earphone jack is connected to the microphone input. Note the opto's transistor gets its power from the computer just like a microphone and also notice the computer ground is not connected to the circuit's ground; that isolation is a good idea. (On some older sound cards you may need to connect tip and ring together to get power to the opto as you would a microphone.) Turn down the gain of the microphone input; open the microphone control panel (often called "recording devices") and turn the sensitivity way down. I recommend Spectrum Lab for plotting the data. (example SL settings files). In Spectrum Lab under "components" there's an input monitor that opens a small oscilloscope view of the input level. Adjust the computer's microphone gain until that signal is small. Below is a screen from Spectrum Lab driven by this V/F. I've chosen "multi-strip" waterfall with 220 pixels each under the Spectrum (1) tab and the Waterfall Scroll rate is set to 10 seconds. The top strip is scrolling from the right and is the latest data with older strips dropping down. I connected a voltage source near the end of the top plot and recorded several 1/2 volt steps. Looks like the zero might be a tad high. Spectrum Lab can save these multi-strip plots on a schedule, too. I'm using an old monitor with an old "Atom" computer and SL is using only 7% of the CPU! I saved this image over the network and SL didn't miss a beat while I was doing that. That's a nice advantage of this approach; one can use other programs simultaneously.
. 
Just as a demo, I switched to a single strip, sped up SL to 200mS scroll rate, and applied a 1 volt, 0.01 Hz sine wave. It's not a bad way to plot slow data.


This simplified PicAXE crystal-controlled frequency counter may be combined with one of my gated V/F converters to send data to a computer via a serial port at a 1.5 Hz or 6 Hz rate. 6 Hz is commonly used for seismometers and is compatible with JAmaseis logging software. The 1.5 Hz rate is good for DVMs (software "panel" meter) where more resolution is desired at the expense of speed. The schematic shows wiring for 6 Hz and one wire is moved to change to 1.5 Hz (Pin 12 of the HC390 moves from pin 14 of the CD4040 to pin 15). The 6 Hz rate count window is 133.333 mS and the 1.5 Hz rate count window is 533.333 mS both set by the duty-cycle of the 74HC390. Set the V/F range to achieve the desired resolution within the PicAXE's ability to count. (I'd limit the frequency to 60 kHz.) Examples: for 14 bits resolution (16,384 counts) at 1.5 Hz the V/F would be set to peak at 16,384/.533333 seconds = 30.72 kHz and for 12 bits (4096 counts) at 6 Hz the V/F would reach 4096/.133333 seconds = 30.72 kHz also. More or less resolution just involves changing the V/F frequency range. The range of the V/F isn't critical since the gain of a particular circuit will be set to the desired sensitivity at the end or even later on a spreadsheet; the maximum speed of the V/F basically sets the resolution. Other crystals may be used with proportionate change in the count window time. A common 32.768 kHz crystal will count about 17% longer and that's usually fine, too. (38.4/32,768 = 1.17) A zipped folder contains the PicAXE program and a script that will take data from a serial port and type it into any application (picaxetoany) and another script that included time (picaxetoanytime) but that one is best for Excel or LibreOffice because it sends a special command to enter time into an adjacent cell for plotting data vs time. The compiled scripts are included along with the AutoHotKey scripts that can be opened within AutoHotKey (for those of you who are a bit more cautious about programs found on the Internet)! The PicAXE program can be inspected within the PicAXE editor or viewed in notepad without concern. Skip the spreadsheet and AutoHotKey script if you are going to use Jamaseis at 6 Hz. Just tell Jamaseis the correct port (the PicAXE editor can tell you the port). I know this counter can look difficult to build but it's truly easy and "programming" involves a cut/paste of the PicAXE program followed by clicking the "program" button in the editor. That's really all it takes. It will work with commercial V/F converters, too.
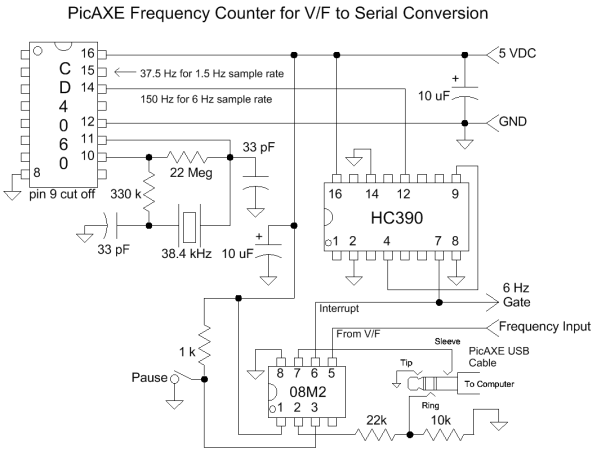
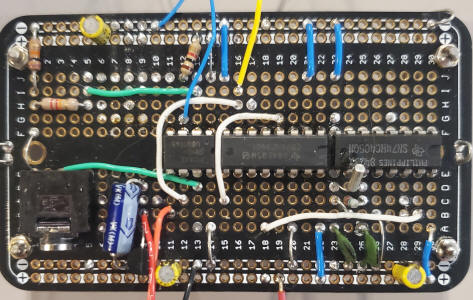
Hint: don't probe the crystal connections or that area; one false move and the crystal will fail. They can't stand overdrive for a fraction of a second! Add a short wire from pin 10 to see the output of the oscillator. I lost a crystal trying to directly clip onto pin 10! Also, on my prototype pictured above I cut off pin 9 of the '4060 so that I could use that row of holes for part of the circuit and I used a drop of UV epoxy to hold the crystal against the IC; the leads are flimsy.
Below is an improved ratiometric V/F converter that will work well with the counter above. The op-amps aren't critical but should run well on 5 volts and sense ground. Read about other parts considerations down the page at https://techlib.com/area_50/waterhammer.htm (an earlier version of this circuit without the temperature compensation). The 6 Hz gate signal from the counter above may be connected to "Stop" below so that the V/F starts from zero each measurement, giving a steady last digit when displaying the value. (Jumping between, say, 7 and 8 would be quite annoying at six readings per second!) I made boards but there's no reason to do that if you just want one or two; it's not terribly fussy electronics.

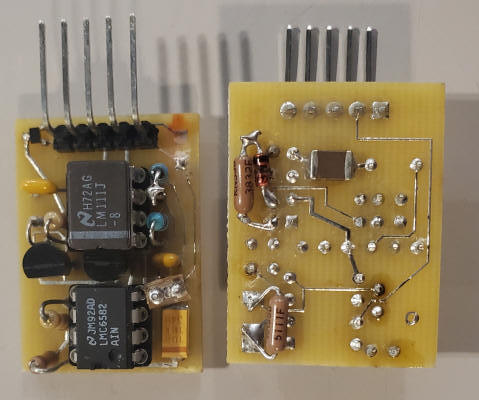
A diode was added (seen on back of board above) to give the comparator's reference voltage a bit of a temperature coefficient that can be further adjusted to remove temp-co due to the comparator, resistors, and anything else. The nominal values shown will improve the circuit nicely but tweaking the value with the help of a temperature chamber can yield exceptional temperature performance. I have several that I've tweaked to exhibit only a couple ppm per degree, despite using ordinary 100 ppm metal film resistors. The linearity resistor may also be tweaked to reduce non-linearity to only a hertz or two with a 35kHz full-scale output. However, the values shown are fine for the vast majority of applications.
